MEC442 Pump Selection Assignment 2: Evaluate Head & Flow for Pump A and B in Series and Parallel Configurations
| University | Universiti Teknologi MARA (UiTM) |
| Subject | MEC442 Fluid Mechanics II |
Assignment
Your company has been assigned to evaluate two pumps; Pump A and Pump B to be used at piping system for transferring water from one large reservoir to another large reservoir that is at a higher elevation as shown in Figure 1. The free surfaces of both reservoirs are exposed to atmospheric pressure.
The piping system specifications at the various parameters are provided in Table 1. Kindly use the data for Hrequired or system curve
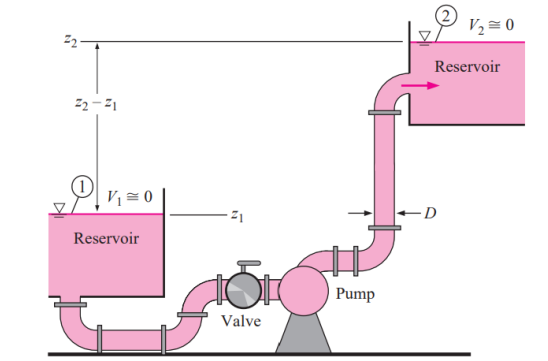
Figure 1: Water pump with piping system
Table 1: Dimensions and minor loss coefficients for piping system
| PARAMETER | GROUP 1, GROUP 5, GROUP 9 |
GROUP 2, GROUP 6, GROUP 10 |
GROUP 3, GROUP 7, GROUP 11 |
GROUP 4, GROUP 8, GROUP 12 |
|---|---|---|---|---|
| Pipe Diameter, D (cm) | 2.03 | 2.03 | 2.03 | 2.03 |
| Roughness, ɛ (mm) | 0.25 | 0.25 | 0.25 | 0.25 |
| KL, inlet | 0.50 | 0.50 | 0.50 | 0.50 |
| KL, valve | 17.5 | 18 | 18.5 | 19 |
| KL, elbow | 0.92 | 0.90 | 0.88 | 0.86 |
| KL, exit | 1.05 | 1.05 | 1.05 | 1.05 |
| Total pipe length, L (m) | 176 | 180 | 185 | 190 |
| Elevation difference, z2-z1 (m) | 7 | 9 | 18 | 18 |
The performance curve (manufacturer data) for Pump A is given by an equation while Pump B is given in tabulated form. Kindly use the data for Havailable for both pump A and pump B to be installed in the same piping system in Figure 1 and Table 1.
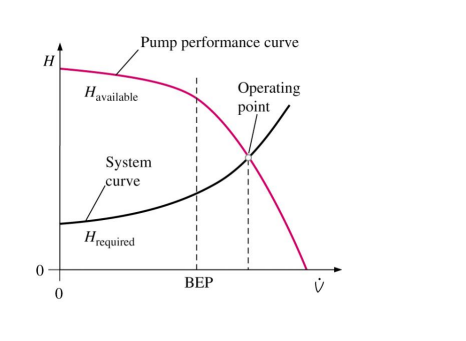
General Pump Performance Curve
Using Microsoft Excel:
1. For Pump A
The pump performance curve (manufacturer data) is approximated by the expression:
By varying Q from 0 Lpm to 20 Lpm, plot the Hrequired and Havailable on a clearly labeled graph and determine the operating head and flow rate.
[20 Marks]
2. For Pump B
The impeller has uniform blade height of 50 mm, with the impeller inlet of 40 mm and outlet radius of 80 mm, respectively. The exit blade angle is 15° and that the tangential velocity component of the water entering the blade is zero. Assuming ideal flow conditions, fill in the pump performance curve (manufacturer data) as shown in Table 2 below.
Plot the Hrequired and Havailable versus Q from 0 Lpm to 30 Lpm. Clearly label the graph and indicate the operating point. State the equation represents by the curve.
Table 2: Pump B performance data
| Q (LPM) | H (m) |
|---|---|
| 0 | |
| 5 | |
| 10 | |
| 15 | |
| 20 | |
| 25 | |
| 30 |
[20 Marks]
3. Evaluate the sum of Head and Volume Flow Rate, Q if Pump A and B connected in
a) Series
b) Parallel
[10 Marks]
Show all work, calculations, and tabulated data.
[Note: Assume density of water is 1000 kg/m3 and viscosity is 1.002 × 10⁻³ kg/m⋅s]
Get Help By Expert

Recent Solved Questions
- Cyber Forensics & Information Technology Assignment, LBS, Malaysia Describe windows system artifacts, Outline the key artifacts from the windows operating system
- Public Law Course Work, UiTM, Malaysia In response to the judicial outcome of the Afghan Hijackers case, then-future Prime Minister of the United Kingdom
- Object Oriented Programming Assignment, UKM, Malaysia A student class has the following properties: Data Member Sample Data ID 2345, 4001 scores 56, 87, 0, 70 grade ‘A’, ‘B’. Methods public int getId()
- AICT004-3-2-NWN: Networks and Networking Assignment, APU, Malaysia You are required to design and apply an IP addressing scheme for the topology shown for The Evergreen Resort network
- BBF305/03: Investment and Portfolio Management Assignment, WOU, Malaysia Corus Berhad is interested to invest in bonds Currently, the financial manager is evaluating both Bond A and Bond B
- Advanced Financial Management Assignment, UUM, Malaysia Show an excellent description and discussion of issues and material with evidence of critical evaluation of issues and material
- BBF30403: SunTech Bhd is a company that owns several technology stores in Malaysia: Corporate Finance Assignment, WOU, Malaysia
- Professional Management and Leadership Assignment, OUM, Malaysia You need to draw on leadership and management theories to demonstrate understanding and application of the module content of “Management, Leadership, Vision/Mission/Strategy
- BMG323: Using market basket analysis, construct a combination of two purchased items into an appropriate: BUSINESS ANALYTICS Assignment, WOU, Malaysia
- CSC508: Data Structure Assignment, UiTM, Malaysia Define your own Binary Search Tree (BST) data structure using Linked List